| HOME | More Articles | Prev: Cost Budgeting | Next: Using Software to Assist in Cost Management |
|
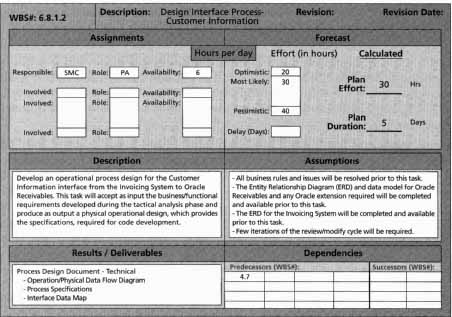
Project cost control includes monitoring cost performance, ensuring that only appropriate project changes are included in a revised cost baseline, and inform ing project stakeholders of authorized changes to the project that will affect costs. The cost baseline, performance reports, change requests, and the cost management plan are inputs to the cost control process. Outputs of this process are revised cost estimates, budget updates, corrective action, revised estimates for project completion, and lessons learned. Several tools and techniques assist in project cost control. There must be some change control system to define procedures for changing the cost base line. This cost control change system is part of the integrated change control system described in the subject area “Project Integration Management”. Since many projects do not progress exactly as planned, new or revised cost estimates are often required, as are estimates to evaluate alternate courses of action. Another very important tool for cost control is performance measurement. Although many general accounting approaches are available for measuring cost performance, there is a very powerful cost control tool that is unique to the field of project management-earned value management (EVM). Earned Value ManagementEarned value management (EVM) is a project performance measurement technique that integrates scope, time, and cost data. Earned value management is sometimes called earned value analysis (EVA), which should not be confused with economic value added, also referred to as EVA. Given a cost performance baseline, project managers and their teams can determine how well the project is meeting scope, time, and cost goals by entering actual information and then comparing it to the baseline. A baseline is the original project plan plus approved changes. Actual information includes whether or not a WBS item was completed or approximately how much of the work was completed, when the work actually started and ended, and how much it actually cost to do the work that was completed. Figure 1 below shows the Business Systems Replacement project’s input form for collecting information for cost control and earned value management. This internal company form includes the following information: • Descriptive information: The top line of this form lists the WBS number for an activity, a description of the activity, a revision number, and a revision date. This example of an input form reports information for WBS Item 6.8.1.2, a level 4 WBS activity (based on the numbering scheme) called “Design Interface Process-Customer Information.” • Assignment information: This activity is assigned to someone with the initials SMC. Other assignment information includes the responsible person’s role and number of hours available per day for the activity. • Forecast information: The BSR project used a PERT weighted average to estimate the number of hours it would take to complete activities. Since the PERT weighted average uses most likely, optimistic, and pessimistic estimates. In this case, the PERT calculation results in a planned effort of thirty hours. The planned duration is five days. • Description: This section provides a detailed description of the activity. • Assumptions: Major assumptions related to this particular WBS item are documented here. • Results/Deliverables: This section briefly lists the main outcomes from the WBS item. • Dependencies: This section lists the WBS number for any predecessor or successor activities. This particular activity has not yet started, so it does not include the actual number of hours or the actual duration for the activity. Actual cost, actual duration, and percentage complete information is required in order to perform earned value management. Earned value management involves calculating three values for each activity or summary activity from a project’s WBS. 1. The planned value (PV), formerly called the budgeted cost of work scheduled (BCWS), also called the budget, is that portion of the approved total cost estimate planned to be spent on an activity during a given period. Table 6-6 shows an example of earned value calculations. Suppose a project included a summary activity of purchasing and installing a new Web server. Suppose further that according to the plan, it would take one week and cost a total of $10,000 for the labor hours, hardware, and software involved. The planned value (PV) for that activity that week is, therefore, $10,000. 2. The actual cost (AC), formerly called the actual cost of work performed (ACWP), is the total direct and indirect costs incurred in accomplishing work on an activity during a given period. For example, suppose it actually took two weeks and cost $20,000 to purchase and install the new Web server. Assume that $15,000 of these actual costs was incurred during week I and $5,000 was incurred during week 2. These amounts are the actual cost (AC) for the activity each week. 3. The earned value (EV), formerly called the budgeted cost of work per formed (BCWP), is the percentage of work actually completed multiplied by the planned value. Again, using the example in the Table below, suppose you estimated the activity of purchasing and installing a Web server to be 75 percent complete after week 1. To calculate the earned value (EV) for week 1, you would multiply the planned value of $10,000 for week 1 by 75 percent to get an earned value of $7,500 for that activity at that point in time. Table: Earned Value Calculations for One Activity After Week One
The earned value calculations in the Table above are carried out as follows: EV = $10,000 x 75% = $7,500 CV = 7,500 - 15,000 = -7,500 SV = 7,500 - 10,000 = -2,500 CPI = 7= 50% SPI = 7,500/10,000 = 75% The next Table (below) summarizes the formulas used in earned value management. Note that all of these formulas start with EV, the earned value. Variances are calculated by subtracting the actual cost or planned value from EV, and indexes are calculated by dividing EV by the actual cost or planned value. Table: Earned Value Formulas
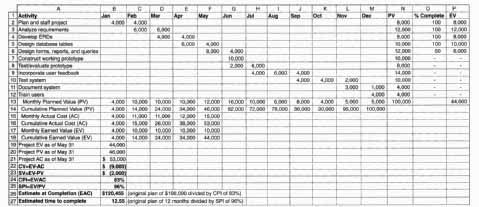
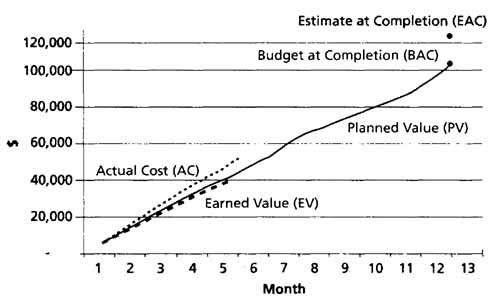
Cost variance (CV) is the earned value minus the actual cost. In other words, cost variance shows the difference between the estimated cost of an activity and the actual cost of that activity. If cost variance is a negative number, it means that performing the work cost more than planned. If cost variance is a positive number, it means that performing the work cost less than planned. Schedule variance (SV) is the earned value minus the planned value. Schedule variance shows the difference between the scheduled completion of an activity and the actual completion of that activity. A negative schedule variance means that it took longer than planned to perform the work, and a positive schedule variance means that it took less time than planned to per form the work. The cost performance index (CPI) is the ratio of earned value to actual cost and can be used to estimate the projected cost of completing the project. If the cost performance index is equal to one or 100 percent, then the planned and actual costs are equal, or the costs are exactly as budgeted. If the cost performance index is less than one or less than 100 percent, the project is over budget. If the cost performance index is greater than one or more than 100 percent, the project is under budget. The schedule performance index (SPI) is the ratio of earned value to planned value and can be used to estimate the projected time to complete the project. Similar to the cost performance index, a schedule performance index of one or 100 percent means the project is on schedule. If the schedule performance index is greater than one or 100 percent, then the project is ahead of schedule. If the schedule performance index is less than one or 100 percent, the project is behind schedule. Note that in general, negative numbers for cost and schedule variance indicate problems in those areas. Negative numbers mean the project is costing more than planned or taking longer than planned. Likewise, CPI and SPI less than one or less than 100 percent also indicate problems. Earned value calculations for all project activities (or summary level activities) are required to estimate the earned value for the entire project. Some activities may be over budget or behind schedule, but others may be under budget and ahead of schedule. By adding all of the earned values for all project activities, you can determine how the project as a whole is performing. Figure 2 provides sample earned value information for a one-year project. This project had a planned total cost of $100,000. The spreadsheet shows actual cost and percentage complete information for the first five months, or through the end of May. Notice the “% Complete” column at the upper-right side, or in column 0, of the spreadsheet. The earned value (EV) for each activity is calculated by multiplying the percent complete value by the planned value. The 35 Actual Cost” row (row 1 5 of the spreadsheet) shows the actual cost each month for the project’s activities through May. By calculating the total planned costs, the total actual costs, and the earned value costs, you can deter mine the cost variance, schedule variance, cost performance index, and schedule performance index for the entire project (see cells A18 through B25 in Figure 2). In this example, the cost variance is -$9,000, and the schedule variance is -$2,000. These values mean that the project is both over budget and behind schedule after five months. The cost performance and schedule performance indexes are 83 percent and 96 percent, respectively. The cost performance index can be used to calculate the estimate at completion (EAC) -- an estimate of what it will cost to complete the project based on performance to date. Similarly, the schedule performance index can be used to calculate an estimated time to complete the project. For example, in Figure 2 the estimated cost at completion is $120,455, or $ 100,000/83 percent. The estimated time to complete the project is 12.55 months, or twelve months/96 percent (see cells A26 through B27). You can graph earned value information to track project performance. Figure 3 shows an earned value chart for the one-year sample project from Figure 2. The chart includes three lines and two points, as follows: • Planned value (PV), the cumulative planned amounts for all activities by month. Note that the planned value line extends for the estimated length of the entire project. • Actual cost (AC), the cumulative actual amounts for all activities by month • Earned value (EV), the cumulative earned value amounts for all activities by month • Budget at Completion (BAC), the original total budget for the project, or $100,000 in this example. • The BAC point is plotted on the chart at the original time estimate of twelve months. • Estimate at Completion (EAC), estimated to be $120,455, as described earlier. This EAC point is plotted on the chart at the estimated time to complete of 12.55 months. Viewing earned value information in chart form helps you to visualize how the project is performing. For example, you can see the planned performance by looking at the planned value line. If the project goes as planned, it will finish in twelve months and cost $100,000, represented by budget at completion, or BAG. Notice in this example that the actual cost line is always right on or above the earned value line. When the actual cost line is right on or above the earned value line, costs are equal to or more than planned. The planned value line is pretty close to the earned value line, just slightly higher in the last month. This relationship means that the project has been right on schedule until the last month, when the project got a little behind schedule. Senior managers overseeing multiple projects often like to see performance information in a graphical form such as this earned value chart. For example, in the opening case, the government officials were reviewing earned value charts and estimates at completion for several different projects. Earned value charts allow you to quickly see how projects are performing. If there are serious cost and schedule performance problems, senior management may decide to terminate projects or take other corrective action. The estimates at completion are important inputs to budget decisions, especially if total funds are limited. Earned value management is an important technique because, when used effectively, it helps senior management and project managers evaluate progress and make sound management decisions. However, earned value management is not used on many projects outside of government agencies and their contractors. Two reasons earned value management is not used more widely are its focus on tracking actual performance versus planned performance and the importance of percentage completion data in making calculations. Many projects, particularly information technology projects, do not have good planning information, so tracking performance against a plan might produce misleading information. Several estimates are usually made on information technology projects, and keeping track of the most recent estimate and the actual costs associated with it could be cumbersome. In addition, estimating percentage completion of tasks might produce misleading information. What does it really mean to say that a task is 75 percent complete after three months? Such a statement is often not synonymous with saying the task will be finished in one more month or after spending an additional 25 percent of the planned budget. To make earned value management simpler to use, organizations can modify the level of detail and still reap the benefits of the technique. For example, you can use percentage completion data such as 0 percent for items not yet started, 50 percent for items in progress, and 100 percent for completed tasks. As long as the project is defined in enough detail, this simplified percentage completion data should provide enough summary information to allow managers to see how well a project is doing overall. You can get very accurate total project performance information using these simple percentage complete amounts. For example, using simplified percentage complete amounts for a one-year project with weekly reporting and an average task or work packet size of one week, you can expect about a 1 percent error rate. Earned value management is the primary method available for integrating performance, cost, and schedule data. It can be a powerful tool for project managers and senior management to use in evaluating project performance. |
 |
HOME | More Articles | Prev: Cost Budgeting | Next: Using Software to Assist in Cost Management |